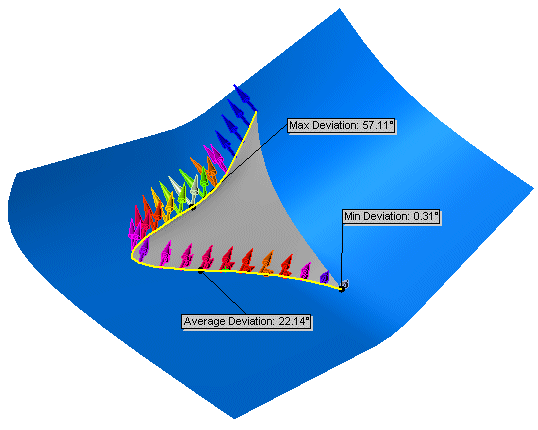
Deviation Analysis
The Deviation Analysis tool
is a diagnostic tool that calculates the angle between faces. You can
select a single edge or a series of edges. The edges can be between faces
on a surface, or any edges on a solid.
The analysis is based on the number of sample points that you select
along the edges. You can examine operations which fail or have the potential
for failure in any of the following situations:
-
Molds. Investigate problems
with mold tooling along the split line of the mold, in conjunction with
the Draft
Analysis tool.
-
Fillets. Identify potential
problems along tangent faces where a fillet operation fails.
Tangency requirements.
Check along the edges of lofts, sweeps, or surface fills and verify that
tangency requirements are met.
-
Maximum deviation. Identify
problem areas along the edges of sweeps, lofts, or surface fills where
there is maximum deviation.
After you use the Deviation Analysis
tool, you can modify the results by controlling the appropriate entities
within the model. For example, when you examine an edge along a surface fill, deviation analysis
results vary according to the following:
Curvature Control.
Select Contact or Tangent.
Normally, Tangent yields a lower
deviation between adjoining faces.
Optimize surface.
Use the standard patch, or, with two, three, and four sided edges, apply
the Optimize surface option to
use the more efficient simplified patch.
To apply a deviation analysis:
-
Open the model with the edges you want to examine.
Note: The sample model on
the right uses a surface fill.
-
Click Deviation Analysis
 on the Tools toolbar, or Tools,
Deviation Analysis. on the Tools toolbar, or Tools,
Deviation Analysis.
The Deviation
Analysis PropertyManager appears.
|

|
Under Analysis
Parameters  , select the edges in the graphics area
that you want to examine. , select the edges in the graphics area
that you want to examine. -
Use the slider to select the Number
of Sample Points  to
include in the analysis. to
include in the analysis.
NOTE: The number of points
is based on the size of the window client area. If you select more than
one edge, the sample points are distributed across the selected edges,
proportional to the edge length.
-
Click Calculate.
The colored arrows display the amount of deviation. The results
appear for the following criteria between the adjacent faces:
Maximum Deviation
- the maximum deviation error along the selected edge. Minimum Deviation
- the minimum deviation error along the selected edge. Average
Deviation - the average between the maximum and the minimum values
along the selected edge.
 You can change the
display colors for Maximum Deviation
and for Minimum Deviation. To
change the colors, click Edit Color
to display the Color palettes,
select a color for each deviation type, and click Calculate
to apply the new colors. You can change the
display colors for Maximum Deviation
and for Minimum Deviation. To
change the colors, click Edit Color
to display the Color palettes,
select a color for each deviation type, and click Calculate
to apply the new colors.
|
|

|