Viewing the Results
You can view the results of a 2D analysis in 2D or 3D. For an axisymmetric analysis, the results are the same for any cross section about the axis of revolution.
- In the Simulation study tree, open the Results
 folder.
- Double-click Stress (-von Mises-) to display the plot.

By default, you view the results in 2D.
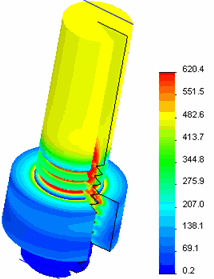
- Right-click Stress (-von Mises-) and select Show as 3D plot.
By default, the 2D section revolves by 330°. You can change the angle in the Stress Plot PropertyManager under Advanced Options.

The result shows plastic deformation on the model. Among the contacting threads, the first engaged thread shows a high stress value. The values are lower for the subsequent threads.