SN Curve
You define SN curves for use in a fatigue study. An SN curve for
a material defines alternating stress values versus the number of cycles
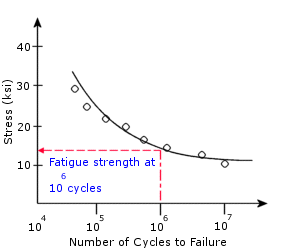
required to cause failure at a given stress ratio. A typical S-N curve
is shown in the figure. The Y- axis represents the alternating stress
(S) and the X-axis represents the number of cycles (N). An SN curve is
based on a stress ratio or mean stress. You can define multiple SN curves
with different stress ratios for a material. The software uses linear
interpolation to extract data when you define multiple SN curves for a
material.
SN curves are based on mean fatigue life or a given probability of failure.
Generating an SN curve for a material requires many tests to statistically
vary the alternating stress, mean stress (or stress ratio), and count
the number of cycles.
Tests to generate SN curves are performed under a controlled loading
environment. Uniaxial loading is commonly used. Since the actual loading
environment is generally multi-axial, a correction may be required. The
software provides the Fatigue strength
reduction factor in the Fatigue
properties dialog to account for this discrepancy.
 When one SN curve with stress ratio -1 (fully
reversible or zero mean) is used to define the fatigue properties of a
material, you can select a correction
method to account for the effects of non-zero mean stresses.

Usually the base 10 logarithm of N
is used instead of N due to the
typical large range of N values.
Defining fatigue SN curves
SN curves are defined in the fatigue study, after you define a fatigue
event. You can define SN curves:
In the Material
dialog, on the Fatigue SN Curves
tab, or
Right-clicking the top document icon and selecting
Define Function Curves.
To create a new SN curve:
In a Fatigue study, add a fatigue event.
In the Material
dialog, on the Fatigue SN Curves
tab, in the Source box do the
following:
For Interpolate,
set the scheme for interpolating alternating
stresses against the number of cycles of S-N curve.
Select Define
and select
a curve from the ten curves that appear in the menu.
In the Table
data box, do the following:
In the Stress ratio (R)
box, enter the stress ratio associated with the curve.
Set the unit of stress.
Populate the curve data by entering Alternating Stress
values versus number of Cycles, or
click File to import a Curve
Data Points File (*.dat).
Note: To add a new row, double-click in cell
under the Points column.
 The
format of the Curve Data Points File (*.dat) should have two columns:
number of Cycles (first column) and Alternating Stress (second column).
Click View
to graph the data or Save to save
the curve to a library.
Preview
box shows the curve as it is defined.
To delete a row, highlight it and click the
Delete key or right-click it and
select Delete.
Type a source of reference for the SN curve
data in Source.
To define an SN curve for a material:
 Some
materials in the material library have SN curves defined. These material
are identified by a (SN) attached
to the end of their names in the list box. Materials with stress-strain
curves are identified by (SS), and materials with both SN curves and stress-strain
curves are identified by (SS,SN).
In the Material
dialog, on the Fatigue SN Curves
tab, in the Source box do the
following:
Set the scheme for interpolating alternating stresses against the number
of cycles of SN curve for Interpolate.
Select Derive
from material Elastic Modulus and
select Based on ASME Austentic Steel curves
or Based on
ASME Carbon Steel curves.
Click Apply.
Related Topics
Fatigue
Events
Performing
Fatigue Analysis
Theory
of Accumulated Damage
Fatigue
Plots