When you have an assembly open with all component materials specified or excluded, the Task Pane opens to the Assembly Process to let you specifiy parameters such as the amount of energy required to assemble the product.
To display the Task Pane, open an assembly and then click one of the following:
-
Sustainability
 (Tools toolbar or Evaluate CommandManager tab)
-
Typically, the main Sustainability Task Pane opens. When you analyze an assembly for which a component has an unassigned or unsupported material, a Sustainability Task Pane containing the Task List opens.
Assembly Process
| Region |
Sets the region of manufacture, for example, Asia.
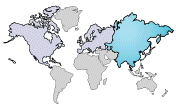
Click the map to set the region.
Available regions are North America, Europe, Asia, Japan, South America, Australia, and India.
Data is not available for all regions. Regions that contain data are highlighted when you hover over them.
|
| Built to last |
Length of time the part will last. The numeric field and increments are editable.
|
| Energy required for assembly process |
Sets the Fuel type (Electricity or Natural Gas) and Amount required to manufacture the assembly. |
Use
| Region |
Sets the region where the product is transported and used, for example, Asia. Select a region from the drop-down list or click a region in the map to set the region.
|
| Energy Needs over lifespan |
Specifies the Type of energy and Amount of energy that is used over the products's lifespan. Energy choices are:
- Electricity
- Natural Gas
- Diesel
- Gasoline
- Kerosene
- Light Fuel Oil
|
Transportation
Shows the default mode of transportation and distance traveled from the Manufacturing region to the Use region.
To edit these values, click a transportation mode's button and type in the field that is enabled. When you add values for a transportation mode or modify the default mode, the field turns yellow and a Reset to Defaults button appears to let you discard your changes.
End of Life
Shows default percentages based on the value of the materials in the sustainability database. The values of all the components in the assembly are rolled up by weight.
 |
Recycled |
 |
Incinerated |
 |
Landfill |
The total of the values always equals 100%. If you change the recycled or incinerated value, the landfill value updates. If you change the landfill value, the recycled value changes.
When you edit a value, the field turns yellow and a Reset to Defaults button appears to let you discard your changes.
Environmental Impact
The Environmental Impact dashboard provides real-time feedback about the environmental impact of the design. SolidWorks Sustainability products use the CML environmental impact assessment methodology (Institute of Environmental Sciences at Leiden University) to calculate the environmental indicators (global warming, eutrophication, and acidification). This methodology is frequently used in life cycle assessment (LCA) studies worldwide.
| Impact Parameters |
 |
Display the impact for each parameter on the environment impact areas. Use is only calculated for assemblies.
|
| Duration of Use |
|
Length of time the product will be used. This number is used in conjunction with the Built to Last value in the Manufacturing section to calculate more accurate results.
In SustainabilityXpress, this value defaults to 1 year.
In full Sustainability, the numeric field and increments are editable.
|
| Environmental Impact Areas |
Pie charts show the percentage of impact of each parameter on the four environmental impact areas.Bars below each pie chart compare the current material to the previous or baseline material.
Green bars indicate the current material has a lower environmental impact than the previous material.
Red bars indicate the current material has a higher environmental impact than the previous material.
Mouse over the bars to see the current and baseline values. 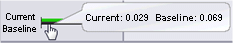
Arrows beside the pie charts emphasize the increase  or decrease or decrease  in environmental impact and the percentage of change. in environmental impact and the percentage of change.
|
- Carbon Footprint
- A measure of carbon dioxide and equivalents, such as carbon monoxide and methane, that are released into the atmosphere primarily by burning fossil fuels.
- Energy Consumption
- All forms of nonrenewable energy consumed over the entire life cycle of the product.
- Air Acidification
- Acidic emissions, such as sulfur dioxide and nitrous oxides, which eventually lead to acid rain.
- Water Eutrophication
- Contamination of water ecosystems by waste water and fertilizers, resulting in algae blooms and the eventual death of plant and animal life.
|
| Home |
 |
Returns you to the initial display of the Environmental Impact Dashboard. |
| Generate Report |
 |
Creates a Microsoft® Word document that summarizes the results of the current and baseline environmental impacts. You can customize the reports, for example the header, by modifying the report template at
install_dir\lang\language\sustainability_report.dotx.
Report customization affects all users of the computer where the template is stored.
|
| Send Report |
 |
Generates a report, opens a new message in your default email application, and attaches the Microsoft® Word document. |
| Set Baseline |
 |
Sets the current selections in the Task Pane as the baseline against which you compare different selections. The Baseline bar is the bottom bar below the pie charts. |
| Import Baseline |
 |
Lets you import an existing baseline to use in the current model. |
| Online Info |
 |
Opens a Web site that provides additional information about Sustainability, including a calculator to help you understand the impact of your design. |