Selection of Frequency Points
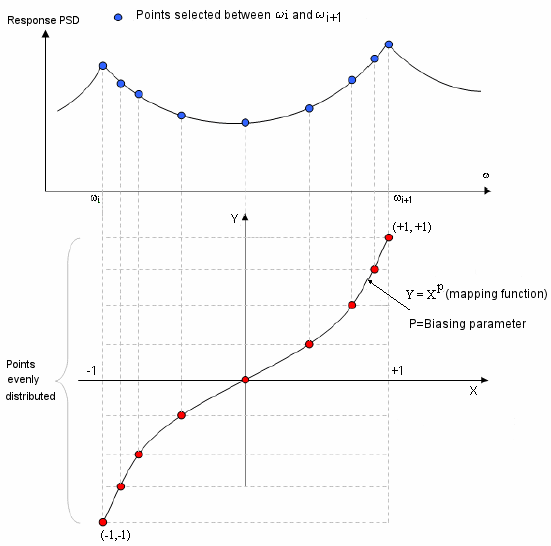
The figure below illustrates the distribution of the frequencies at which the solution is calculated for random vibration studies.

The normalized mapping function is Y = XP where:
P = biasing parameter (power).
Y = uniform scaling between -1 and 1 with the requested number of frequency points.
X = normalized to correspond to -1 for w1 and +1 for wi+1
Related Topics
Analysis Procedure - Random Vibration
Methods of Integration