Frequency Curve
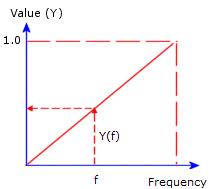
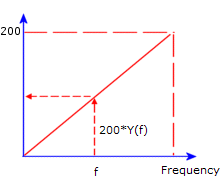
The Frequency Curve dialog box lets you define or import a frequency curve to define frequency-dependent quantities for harmonic and random vibration linear dynamic studies. You define X and Y pairs or read them from a text file. The Y value of the frequency curve is a multiplier to the associated quantity. For example, a force of 200 psi associated with curve A specifies a force as shown in curve B. At any frequency (f), the value of the force applied by the program is equal to the specified force value times the Y-value of curve A at frequency (f). You can define up to 5000 points.
|

|

|
|
Curve A - Frequency Curve
|
Curve B - Actual Load or Base Excitation
|
To define a frequency curve:
-
In the PropertyManager of a load or base excitation in a harmonic or random vibration study, under Variation with frequency, do one of the following:
-or-
-
-
Click Edit.
The Frequency Curve dialog box opens.
-
In the Curve information box, type a name for the curve.
-
Set the Units for the X (rad/sec or Hz) column. The Y values are dimensionless multipliers to the quantity specified in the PropertyManager for the associated load or base excitation.
-
Edit the curve data as desired. To get the curve from an external file, click Get curve.
The Function Curves dialog box opens.
 The X-Y columns show the default values based on the selected shape. You can edit the values in the cells as desired. To add a row, double-click in any cell in the Points column. To delete selected rows, right-click the selection and select Delete.
-
To save the curve for subsequent use, click Save Curve, specify a name and a destination folder for the curve file and click Save.
The program adds the extension .cwcur to the filename. The specified curve can be used in other documents.
-
Click OK.
You will return to the load/restraint PropertyManager.
-
To view the actual values of the specified load/restraint, under Variation with frequency, click View.
-
Close the graph window.
To use a frequency curve from an existing library:
-
In a load or restraint PropertyManager in a transient thermal or nonlinear study, under Variation with frequency, click Curve then click Edit.
-
In the Frequency curve dialog box, click Get Curve.
The Function Curves dialog box opens.
-
Select the desired curve library file (*.cwcur). The existing curve data files are listed under Frequency curve.
-
Under Curve Library, select the desired frequency curve.
The curve data appears in the dialog box.
-
If needed, modify the curve data then click OK.
You will return to the Frequency Curve dialog box.
-
Click OK.
You return to the PropertyManager.