Vector Plots
You can control the appearance of the vector symbols dynamically in a vector plot.
To customize a vector plot:
-
After running your study, create a vector plot of the desired result.
-
Right-click the vector plot icon and select Vector Plot Options.
The Vector Plot Options PropertyManager appears.
-
Use the spin arrows to control the Size  of the vector arrows.
-
Use the spin arrows to adjust the Density  of the vectors in the plot.
-
If desired, check Surface only to plot the vectors on the model boundaries only.
-
Select Match chart color to use the same color map used in the plot or Single color to use a single color for the vector plot. To change this color, click Edit color.
-
Click OK  .
.
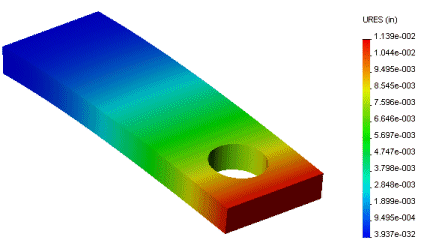
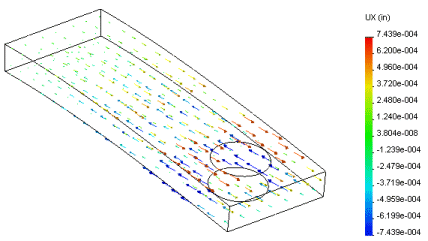
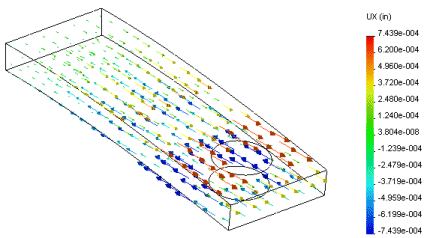
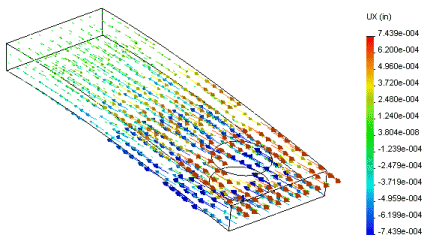
The following is an illustration of the vector plot options:
|

Resultant displacement fringe plot
|

Resultant displacement vector plot (default vector options)
|
|

Resultant displacement Vector plot with bigger vector size
|

Resultant displacement Vector plot with larger vector density
|