After you perform a fatigue analysis, you can plot life, damage and factor of safety plots for the model.
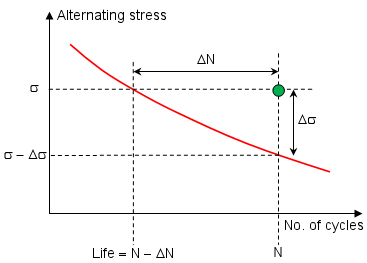
Suppose you run a static analysis and define a fatigue study with the static analysis being the only event that occurs N times. Consider the S-N curve for the material as shown:

The program, based on the loading ratio, determines a corrected alternating stress from the static study's stress value for each node.
In the graph above, the green dot represents the alternating stress (Y coordinate) and number of cycles for which the event occurs (X coordinate) for one node. One out of three possible outcomes can occur for each node:
- The dot lies above the curve. Fatigue failure is predicted at that location.
- The dot lies below the curve. Fatigue failure does not occur at that location.
- The dot lies outside the range of S-N curve. The highest corrected alternating stress in the model must be within the stress range of the S-N curve. Also, the number of cycles (N) should be within the cycle range of the S-N curve. Otherwise, instead of an intersection point, the program uses the S-N curve's end point.
To simplify the discussion, we did not consider the scenarios where multiple S-N curves for a material and several events are defined.
This table describes Life, Damage, and Factor of Safety.
| Fatigue Plots |
Description |
Relation |
Notes |
|---|
| Life |
The number of cycles that causes failure at a model location. In the graph it is the intersection between the horizontal line for σ and the S-N curve. |
Life = N - ΔN |
- Life plot is available only when you define a single event.
- Life value depends only on the stress value at a location and the S-N curve. It does not depend on the number of fatigue cycles.
- If the corrected alternating stress in the model falls below the stress level of the last point of the S-N curve, the program takes the number of cycles defined for the last point of S-N curve, unless you define and select the Infinite Life option in the fatigue study's Properties, in which case the Infinite Life will be taken to calculate the Damage.
- If the event is Variable Amplitude of Constant Amplitude), then the Life results given by the fatigue analysis are in terms of blocks instead of cycles, where blocks are defined as the total load history (including the number of repeats of the event in the curve) specified by the user.
|
| Damage |
The percentage cumulative damage factor or the percentage life consumed. |
Damage = N/(N - ΔN) |
- A value of 1 indicates that the defined fatigue events consume 100% of the model life at that location.
|
| Factor of Safety |
The ratio of the stress value that causes fatigue failure over the stress σ. |
FOS = (σ-Δσ)/σ |
- The FOS plot is available only when a single event is defined in the fatigue study.
- A factor of safety of 2.0 at a location predicts failure at that location when applied loads are multiplied by 2.0.
|