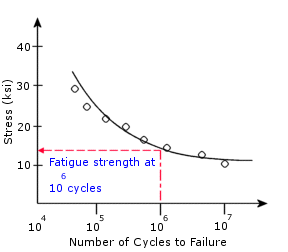
You define SN curves for use in a fatigue study. An SN curve for a material defines alternating stress values versus the number of cycles required to cause failure at a given stress ratio. A typical S-N curve is shown in the figure. The Y- axis represents the alternating stress (S) and the X-axis represents the number of cycles (N). An SN curve is based on a stress ratio or mean stress. You can define multiple SN curves with different stress ratios for a material. The software uses linear interpolation to extract data when you define multiple SN curves for a material.
SN curves are based on mean fatigue life or a given probability of failure. Generating an SN curve for a material requires many tests to statistically vary the alternating stress, mean stress (or stress ratio), and count the number of cycles.
Tests to generate SN curves are performed under a controlled loading environment. Uniaxial loading is commonly used. Since the actual loading environment is generally multi-axial, a correction may be required. The software provides the Fatigue strength reduction factor in the Fatigue properties dialog to account for this discrepancy.
When one SN curve with stress ratio -1 (fully reversible or zero mean) is used to define the fatigue properties of a material, you can select a correction method to account for the effects of non-zero mean stresses.

Usually the base 10 logarithm of N is used instead of N due to the typical large range of N values.