The graphics area displays:
- Callouts for certain loads and boundary conditions as well as mesh controls.
- Plots representing stress, strain, deformation, resonant frequencies, etc. You can split the graphics area to display multiple results simultaneously.
- Symbols representing loads, fixtures, connections, mesh controls.
Callouts
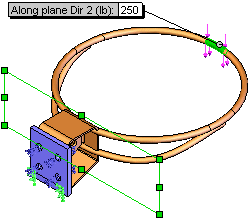
Callouts are text-filled boxes that appear in the graphics area when you use certain tools. You can drag callouts to position them as desired. You can edit the values shown in callouts to manipulate the effect of the load or boundary condition.
The following image shows a callout. You can edit the 250 value to change the force.

Symbols
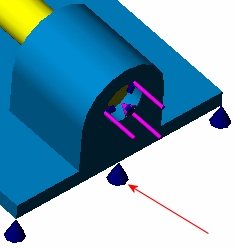
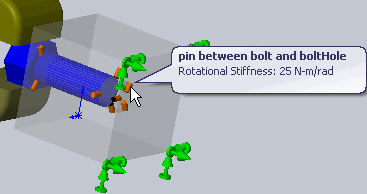
When you add a load, fixture, or other control, the software adds symbols to the model. You can double-click these symbols to access the PropertyManager for the control. The following image highlights a symbol for an elastic support connector. The image also shows the symbols for a force and a bolt connector.

You can hide or show symbols in the graphics area by right-clicking the control in the Simulation study tree. To hide all loads, fixtures, or connections in one operation, right-click External Loads  , Fixtures
  , or Connections
  , respectively, and select Hide All.
To hide or show all Simulation symbols at once, do one of the following:
- Click Hide/Show Items
 (Heads-Up View toolbar) and select or clear View Simulation Symbols
  .
.
- Click
 .
.
When you move the pointer over Simulation symbols, the software displays details of the feature.
