In a response spectrum analysis, the results of a modal analysis are used in terms of a known spectrum to calculate displacements and stresses in the model. For each mode, a response is read from a design spectrum based
on the modal frequency and a given damping ratio. All modal responses are then
combined to provide an estimate of the total response of the
structure.
You can use a response spectrum analysis rather than a time history analysis to estimate the response of structures to random or time-dependent loading environments such as earthquakes, wind loads, ocean wave loads, jet engine thrust or rocket motor vibrations.
|
Response Spectrum
|
Plots peak responses over time for a range of single-degree-of-freedom (SDOF) systems subjected to a particular base motion as a function of their natural frequency ωI, or vibration period TI. Each response spectrum curve corresponds to a particular modal damping ratio ξI. Typical quantities plotted in response spectra are:
-
Maximum displacement Sd(ωI, ξI)
- Maximum pseudo-velocity Sv(ωI, ξI) = ωI*Sd
- Maximum pseudo-acceleration Sa (ωI, ξI) = ωI*Sv = ω2I*Sd
The response spectrum is used as base excitation input for a response spectrum analysis.
|
Relative displacement response spectrum for a particular damping ratio ξ1.
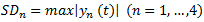 equals the maximum absolute value of the relative displacement time history response for each SDOF oscillator.
|
 |
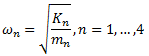 Natural circular frequency of vibration for each SDOF oscillator.
|
|