Creates shear, moment, torque, or axial force diagrams for beams or axial force diagrams for trusses. Beam diagrams are generated in the local directions for each beam.
To display this PropertyManager, run a Simulation study. Right-click Results  and select Define Beam Diagrams.
Display
 |
Component |
Select one of the following:- Axial Force
- Shear Force in Dir 1
- Shear Force in Dir 2
- Moment in Dir 1
- Moment in Dir 2
- Torque
For trusses, only Axial Force is available.
|
 |
Units |
Select the units of the diagram.
|
| |
Render beam profile (slower) |
Displays beam diagrams on actual beam geometry as opposed to cylinders. |
Selected Beams
| All |
Selects all beams.
|
| Select |
Select beams in the graphics area. The software considers only the beams in Selected Beams.
|
| Beam Diagram Width |
Controls the width of beam plots for better visibility.
|
Property
| |
Include title text |
Type a custom title for the plot.
|
| |
Associate plot with name view orientation |
Allows you to associate a predefined view orientation with the active plot.
|
 |
Associate with current view |
Associates the current view with the active plot. |
-
To show beam directions for an active beam diagram,
right-click the beam diagram icon and select Settings. In the PropertyManager, under Deformed Plot Options, select Show beam directions.
The software plots the beam local triad at the center of
each beam.
- When creating a new beam diagram plot, the fields of the
Automatically defined maximum value and
Automatically defined minimum value in
Chart Options show the values of the Shear Force
in Dir1 component regardless of the selected beam component. The software
always shows the actual minimum and maximum values for the selected beam
diagram in the graphics area.
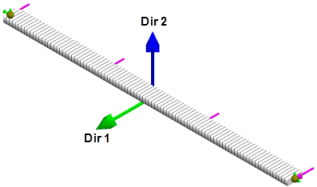
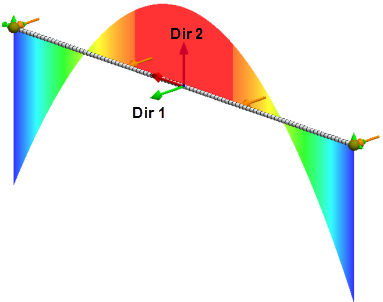
Example of a fixed-fixed beam subjected to a uniformly distributed load
along local Dir 1. The software plots the shear diagram in Dir1 and moment diagram about
Dir 2.
 |
| Fixed-fixed beam subjected to a
uniformly loading along direction1. To view a beam's local
directions, create a Mesh Quality Plot. In
the Settings tab, click Show beam
directions. |
 |
| Shear Force in Dir 1
diagram |
 |
| Moment about Dir 2 diagram |
For a beam subjected to a distributed load acting along local Dir 2, the
software plots shear forces in Dir 2, and moment forces about Dir 1.
Beams or
trusses under axial compressive loads show a negative axial beam stress value
and beams under axial tensile loads show a positive axial beam stress
value.