TolAnalyst results are displayed visually in the graphics area. Warning messages appear if there are potential problems with the setup and evaluation.
Warnings
When TolAnalyst evaluates the study, warning messages appear if there are potential problems with the setup and evaluation. When TolAnalyst identifies the following condition, consider the results with caution.
|
Incomplete Tolerance Chains
|
This warning appears when a complete tolerance chain does not exist between the two measurement features.
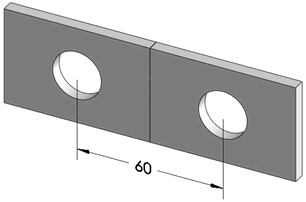
| When performing a study on the distance between the two holes in this assembly, a warning appears about an incomplete tolerance chain.
|
 |
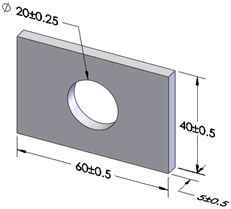
| The warning appears because in the parts, there are no dimensions or tolerances controlling the location of the hole, which is under constrained.
|
 |
|