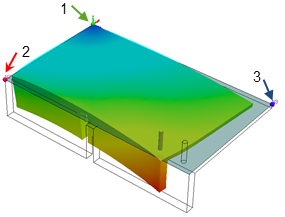
After running a Warp analysis, you can view deformation plots of the part
because of stresses that develop during filling and packing, and stresses because of thermal
contraction after the part has fully cooled.
To open the Warp
Results PropertyManager, do one of the following:
- In the PlasticsManager tree, expand Results, and double-click Warp
Results.
- In the SOLIDWORKS Plastics CommandManager, click Warp Results.
Available Results
| Total Stress Displacement
|
Shows the total deformation of the part after it is
molded and cooled to room temperature. All simulated stresses and
thermal effects are considered in this result. |
| In-mold Residual Stress
Displacement
|
Shows the portion of the deformation because of stress
that develops during fill, pack, and in-mold cool stages. This
stress includes the effects of nonuniform cooling and freezing while
the part is in the mold. |
| Quenching Thermal Stress
Displacement
|
Shows the portion of the deformation that develops
after the de-molding stage, because of the stress associated with
thermal contraction as the part is cooled to room temperature. |
| Total Stress Displacement
(orientation effect) |
Shows an estimate of the total deformation of the part
caused by anisotropy from the orientation of fillers in the
material, such as short glass fibers or carbon fibers. For materials without any fillers, this
deformation is negligible.
|
| Sink-Mark
Profile
|
Shows the depth of sink marks after the part has been
ejected and cooled to room temperature. All thermal stresses and
warping effects are included in this result. |
| In-mold Residual von
Mises Stress |
Shows the magnitude of the residual von Mises stress
inside the part at the end of the in-mold cooling time. |
| De-molding Residual von
Mises Stress |
Shows the magnitude of the residual stress that remains
after the part cools to room temperature, and allowed to deform
freely. |
Advanced
Available for displacement results. These controls affect only the color display of the plot. The deformed shape that is displayed always respects the sign (positive or negative) of the displacement result.
 |
 |
| Displacement Plot Z-direction - Direct
Value |
Displacement Plot Z-direction - Absolute
Value |
Deformation Scale
Available for displacement results.
| Scale |
Magnifies the deformation results.
This is very useful for inspecting warped shapes with tiny
deformations. A Deformation Scale of 1.0
shows the actual deformation. |
Set Reference
Available for displacement results. These controls modify the reference location and orientation used to compute displacement results. Setting a reference can be useful in comparing displacements with those that you measure after placing the part in a checking fixture or jig.
| Based on origin
|
Selects a location on the model as the baseline of
deformation by selecting a node on the model. A glyph is displayed
on the selected origin. Enter 0 in the box to use the default
global origin.
|
| Based on plane
|
Selects three nodes, which define a reference
plane. The deformed part is reoriented such that these three
nodes remain in the reference plane that they define.
|
First Reference
|
Select the first node and click
Apply. This is the origin of
the reference system.
|
|
Second Reference
|
Select the second node, and click
Apply.
|
|
Third Reference
|
Select the third node, and click
Apply.
|
|
| Apply
|
Applies the selected
reference. |
| Reset
|
Resets the reference back to the
default global origin. |
| Fix Reference
Origin |
Adjusts the orientation of the
model to the displayed orientation. |
 |
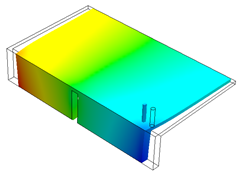
| Displacement plot based on default global origin. |
 |
 |
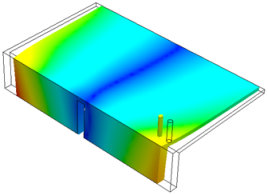
| Displacement plot based on origin selected on the left corner. |
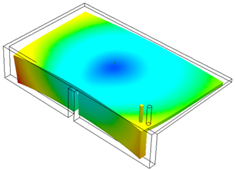
Displacement plot based on a reference plane defined by three
corner nodes. |
Clipping Options
| Clipping Plane
Mode
|
Available for Solid Mesh. Allows
for visualization of results inside the part. Creates a section
view of the selected contour plot.
Select
a plane or a planar face of the model to create a clipping plane
parallel to the selected entity. Select a curved face of the
model to create a clipping plane tangential to the selected
entity. You can adjust the position of a clipping plane by
dragging the arrow symbol.
|
Clipping Plane
|
You can switch between existing
clipping planes.
If you have not explicitly created
any new clipping planes, the default clipping plane
New Clipping
Plane is available. The orientation of
the default New Clipping
Plane is parallel to the Y-Z plane,
and is positioned in the middle of the X-axis.
You can change the orientation of
each plane in (PlasticsManager tree).
|
|
Flip Normal
|
Flips the direction of the vector
normal to the clipping plane.
|
|
Offset Distance
|
Creates a clipping plane at the offset
distance from the selected entity.
|
|
Save
|
Saves the current clipping plane, and
keeps it available for the active study.
|
|
Create
|
Creates a new clipping plane.
|
|
Clipping Plane on Deformed Model
|
Shows the deformed model on the
clipping plane. When this option is cleared, the
original undeformed model is shown.
|
|
| Max |
Specifies
the maximum value of the results shown on the active plot. |
| Min
|
Specifies
the minimum value of the results shown on the active plot. |
Animation
You can animate the warp results plots. Use the available tools to control the animation speed, pause, stop, or loop the animation.
Report Options
| X-Y
plot
|
Creates a graph of analysis results at selected mesh
nodes. Use Measure
(SOLIDWORKS Plastics
CommandManager) to select nodes on the part at locations of
interest. The selected nodes are listed under
Node List. Node
numbers indicate the order of selection.
The graph in the right window displays the result value for each
node. The software assigns numbers to the Curve points in the order
in which you select the nodes. You can select any
of the available results to update the graph with the selected
nodes.
|
| Results Adviser |
Activates the Results
Adviser panel. The top window
provides a brief interpretation of the simulation results,
including any defects, such as short shots, which might have
occurred during filling. It also provides recommendations for
geometry and process parameters changes to improve the product
quality.
At the top of the panel, an icon
of a traffic light indicates the likelihood of the part filling
successfully, based on the value of the injection pressure
relative to the machine injection pressure limit.
- Green: The injection pressure is 66% or
less of the specified machine injection pressure
limit.
- Yellow: The injection pressure is 66%
to 90% of the specified machine injection pressure
limit.
- Red: The injection pressure is 90% or
more of the specified machine injection pressure
limit.
The lower window describes the
active result quantity.
|
| Export
to eDrawings |
Exports the result plot to an
eDrawings file format (*.EPRT). |