|
Evaluation
|
You specify discrete values for each
variable and use sensors as constraints. The software runs the study
using various combinations of the values and reports the output for each
combination.
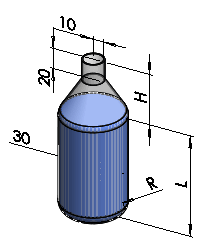
For example, for this multibody model
of a water bottle, you specify values of 75mm, 100mm, and 150mm for the
length (L); 30mm, 55mm, and
80mm for the height (H); and
10mm and 20mm for the radius (R). You specify a Volume sensor to monitor the volume of the water body.
The Design Study results report the volume of the water for each
combination of L, R, and H.

|
|
Optimization
|
You specify values for each variable,
either as discrete values or as a range. You use sensors as constraints
and as goals. The software runs iterations of the values and reports the
optimum combination of values to meet your specified goal.
For example, for the model above, you
specify a range of 75mm to 150mm for the length (L); discrete values 30mm, 55mm, and 80mm for
the height (H); and a range of
10mm to 20mm for the radius (R). For a constraint, you specify a Volume sensor to keep the volume of
the water body between 299000mm^3 and 301000mm^3. For a goal, you use a
Mass
sensor and specify to minimize the mass of the bottle. The Design Study
iterates on the values specified for L, R, H, and Volume, and reports
the optimum combination to produce minimum mass.
|