Description
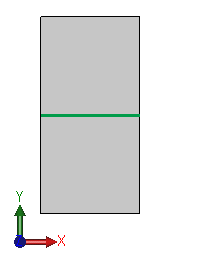
A 1mX2mX0.1m rectangular plate is generating heat at a rate of Q = 100 w/m3. Two adjacent edges are insulated and the two other edges are dissipating heat to the atmosphere at 0 ºC. The plate has orthotropic properties. Determine the steady state temperature distribution in the plate.

File Name
Browse to
drive letter:\Users\Public\Public
Documents\SOLIDWORKS\SOLIDWORKS
version\samples\Simulation
Examples\Verification\Thermal_2.SLDPRT and open the
file.
Study Type
Steady state thermal analysis.
Shell Parameters
Shell thickness = 0.1 m - Thin shell formulation.
Material Properties and Other Inputs
Thermal conductivity in X = KX = 10 w/(m.K), Thermal conductivity in Y = KY = 20 w/(m.ºK ). Convection coefficient along the long edge = h1 = 10 w/m2.K. Convection coefficient along the short edge = h2 = 1 = 20 w/m2.K.
Modeling Hints
One half of the plate is modeled. Insulated conditions are automatic when no other condition is applied.
Results
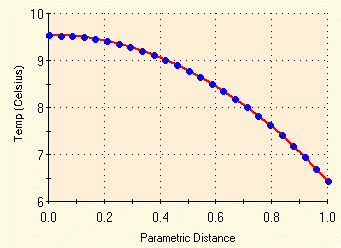
The graph of the temperature variation in the X direction along the bottom edge of the model is shown in the figure below. The graph is in good agreement with reference results.

Plot the temperatures, then right-click on the plot icon and select Probe. Select On Selected Entities, click on the bottom edge of the model, click Update, and then click Plot to generate the graph.
Reference
M. N. Ozisik, “Heat Conduction,” Wiley, New York, 1980.