Determine the nonlinear response at the tip of a straight cantilever
beam subjected to both axial and vertical
end-point
loads.
L = 3.2 m, d = 0.1 m, t = 0.1 m.
|
File Name
|
Open drive
letter:\Users\Public\Public Documents\SOLIDWORKS\SOLIDWORKS version\samples\Simulation
Examples\Verification\NAFEMS_GNL6.SLDPRT.
|
|
Study Type
|
Nonlinear static with large displacement formulation and large strain
option activated.
|
|
Loads
|
- Axial point load P =
3.844 x 10⁶ N
- Vertical point load Q =
P/100 = 3.844 x 10⁴ N
|
|
Material Properties
|
- Elasticity modulus (E) =
2.1 x 10¹¹ N/m2
- Poisson's ratio (ν) =
0
- Mass
density (ρ)= 8200 Kg/m3
|
Results
Define a
Workflow
Sensitive sensor at the tip, and use the Define
Time History Plot tool to plot the graph for the displacement components UY
and UX.
- Vertical UY displacement at tip versus load increment.
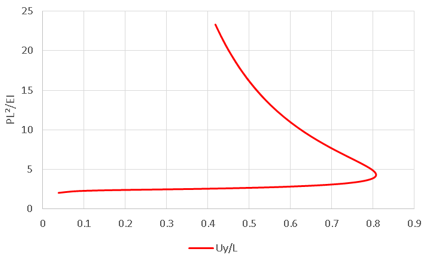
X-axis shows
the
displacement
UY/L in m and Y-axis shows the load
increment PL2 /EI.
- Axial UX displacement at tip versus load increment.
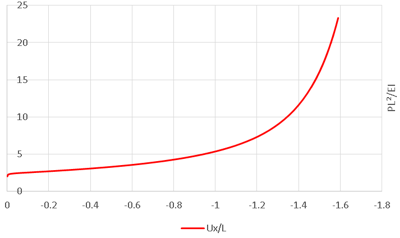
X-axis shows
the
displacement
UX/L in m and Y-axis shows the load
increment PL2/EI.
The load increment versus the deflection curve agrees with the finite
element solution provided in the reference.
| |
Deflection at Tip (m) |
| |
UX/L |
UY/L |
| Load (PL2/EI) |
Reference |
SOLIDWORKS Simulation |
Reference |
SOLIDWORKS Simulation |
| 3.190 |
-0.440 |
-0.448 |
0.719 |
0.724 |
| 22.493 |
-1.577 |
-1.586 |
0.421 |
0.421 |
Reference
NAFEMS Non-Linear Benchmarks, The International
Association for the Engineering Analysis Community, Glasgow, Oct.1989, Rev.1, Test No.
NL6.