A two-beam frame is
loaded with a concentrated vertical load at point A. Determine the response of the frame under
buckling at the location of the applied load.
|
File Name
|
Open drive
letter:\Users\Public\Public Documents\SOLIDWORKS\SOLIDWORKS version\samples\Simulation
Examples\Verification\NAFEMS_GNL7.SLDPRT.
|
|
Study Type
|
Nonlinear static with large displacement formulation and arc-length
option.
|
|
Restraints
|
Joints B and C are simply supported. All joints are restrained for
out-of-plane translation and rotations.
|
|
Material Properties
|
- Elasticity modulus (E) =
71.74 x 10⁹ N/m2
- Poisson's ratio (ν) =
0
- Mass
density (ρ)= 8200 Kg/m3
|
|
Loads
|
Load P = 20000 N is applied incrementally using the arc-length option
with automatic adjustment of arc length.
|
Results
Define a
Workflow
Sensitive sensor at the target location A, and use the Define Time History Plot tool to plot the graph for the
vertical displacement component
Uy
versus the Load factor.
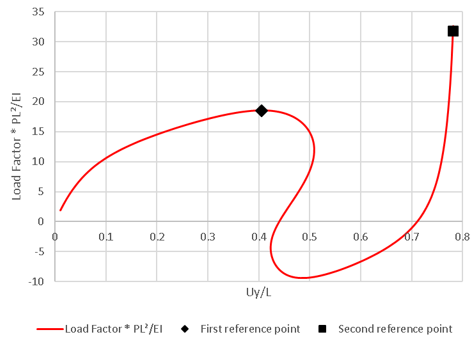
Scale the graph's axes such that:
- The X-axis shows the Uy/L, where Uy is the vertical displacement and L
is the length of each bar equal to 1.2 m.
- The Y-axis shows the Load factor * PL2/EI,
where PL2/EI = 20.072
The Load factor-deflection curve agrees with the finite element
solution provided in the reference.
| |
Deformation ratio (Uy/L) at Point
A |
| Load Factor (PL2/EI) |
Reference |
SOLIDWORKS Simulation |
| 18.552 |
0.407 |
0.405 |
| 31.887 |
0.784 |
0.781 |
Reference
NAFEMS Non-Linear Benchmarks, The International Association for the
Engineering Analysis Community, Glasgow, Oct. 1989, Rev.1, Test No NL7.