Determine the load-displacement curves at points A and B on a
hemispherical shell subjected to point loads.
|
File Name
|
Open drive
letter:\Users\Public\Public Documents\SOLIDWORKS\SOLIDWORKS version\samples\Simulation
Examples\Verification\NAFEMS_3DNLG9.SLDPRT.
|
|
Study Type
|
Nonlinear static with large displacement formulation
|
|
Mesh Type
|
Shell mesh - Thin shell formulation
|
|
Mesh Size
|
Use a standard mesh with global element size of 0.48 in.
|
|
Shell Parameters
|
Shell thickness = 0.04 in - Thin shell formulation
|
|
Material Properties
|
- Modulus of elasticity (E)
= 6.825 x 10⁷ psi
- Poisson's ratio (ν) =
0.3
- Mass density (ρ) = 0.28
lb/in3
|
Results
Plot the result for radial displacement variation with applied load at
points A and B.
Process the results of the analysis using graphing software to
generate the graph.
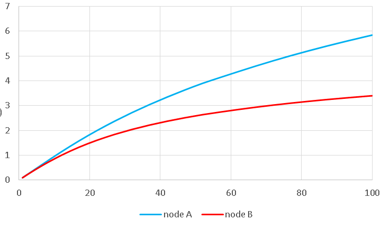
The Y-axis shows
displacements
in inches and the X-axis
shows
the applied load P in pounds. The blue line shows the radial displacement
at point A and the red line shows the radial displacement at point B.
The force-deflection curves agree with the finite element solution provided
in the reference.
| |
Radial Displacement (in) |
| Load (lbf) |
Node |
Reference |
SOLIDWORKS Simulation |
| 100 |
Node A |
-5.952 |
-5.845 |
| 100 |
Node B |
3.427 |
3.399 |
Reference
NAFEMS Publication R0024, The International Association
for the Engineering Analysis Community, “A Review of Benchmark Problems
for Geometric Non-linear Behavior of 3-D Beams and Shells (SUMMARY),
1993”.