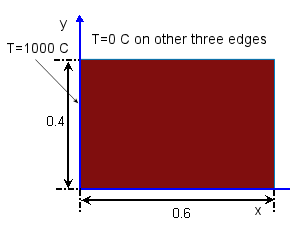
A rectangular plate (0.6 m x 0.4 m) is subjected to a prescribed
temperature distribution, and internal heat generation. Determine the steady state temperature
distribution in the plate at predefined locations A (x = 0.2 m, y = 0.2 m) and B (x= 0.3 m, y =
0.2 m).
For
Study 1, the temperature at one edge of the plate is maintained at
1000
0C, while the temperature at the other three edges is 0
0C.
Dimensions are shown in m.

For Study 2, the temperature at all four edges is
00C. Heat generation of 106 W/m3 is applied to the whole
plate.
|
File Name
|
Open drive
letter:\Users\Public\Public Documents\SOLIDWORKS\SOLIDWORKS
version\samples\Simulation
Examples\Verification\NAFEMS_Thermal_Test9.SLDPRT.
|
|
Study Type
|
Steady state thermal analysis
|
|
Shell Parameters
|
Shell thickness = 0.1 m - Thin shell formulation
|
|
Mesh Size
|
Set Global Size to 1 cm.
|
|
Material Properties
|
- Specific Heat (C) = 460
J/KgK
- Thermal conductivity (K)
= 52 W/mK
- Density (ρ) = 7850
kg/m3
|
Results
Define Workflow
Sensitive sensors at the target locations, and use the
Probe tool to list the temperature values.
| Target
point |
NAFEMS |
SOLIDWORKS Simulation |
| Study 1 (x = 0.2 m, y
= 0.2 m) |
260.5
0C |
260.5 0C |
| Study 2 (x = 0.3 m, y
= 0.2 m) |
310.1
0C |
310.1 0C |
Reference
NAFEMS Publication P16, The International Association for the Engineering
Analysis Community,
"Benchmark
Tests for Thermal Analysis", Test 9 (i) and 9 (ii), YR3087, VOL. 2, 1986.