After you run a fatigue analysis, you can view damage, life and load
factor plots.
-
Click Run
 (Simulation toolbar) to accept the default
settings for the fatigue study properties.
(Simulation toolbar) to accept the default
settings for the fatigue study properties.
To view the fatigue study properties, right-click the
study icon and click Properties.
-
Right-click Results
 and click Define Fatigue Plot.
-
In the PropertyManager, select Damage and click
 .
.
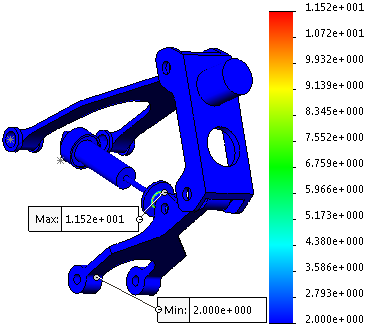
The damage plot shows the percentage of the assembly's life consumed by
the specific fatigue event. The fatigue event consumes only 11.52 % of the assembly's
life.
A rotated view of the model proves that the regions with the highest
damage are the ones predicted (by the Fatigue
Check plot) to be a cause for fatigue concern.
- Repeat steps 2 and 3 to view the Life and Load Factor fatigue results.
The Life plot shows the number of cycles that
causes fatigue failure. The Load Factor plot
shows the load factor of safety for fatigue failure. A load factor of safety of 2
indicates that the fatigue event will cause fatigue failure at this location if you
multiply all loads defined in the reference static study by 2.
For more information about the Fatigue plots, see Simulation Help: Fatigue
Analysis: Fatigue Plots
Congratulations! You have
completed this
tutorial.