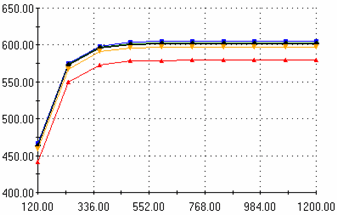
You graph temperature history for the shield.
-
Click Plot Tools
 (Simulation CommandManager) and select Probe
  .
.
-
In the graphics area, select a few locations on the shield.
The selected locations (nodes) are listed under Results in the PropertyManager.
-
Under Report Options,
click Response
 .
.
The graph shows the temperature in Celsius on the Y axis
and time on the X axis in seconds.

-
Close the graph window.
-
Click
 .
.
-
Save your work and close the document.
Congratulations! You have completed this lesson.