Next, you run the bolted connection study and display the results of the 2D analysis in 2D and 3D. For axisymmetric models, the results are the same for any cross section about the axis of revolution.
-
Click Run
 (Simulation
CommandManager).
(Simulation
CommandManager).
In the Simulation study tree, the
Results

folder opens and the
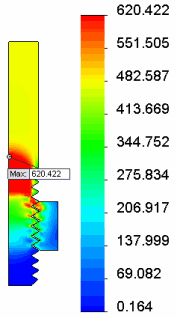
Stress1 (-von Mises-) plot appears.
The
stress results are displayed on the 2D model. The bolt has started to yield as the
highest stress has reached the yield strength of 620.422 Mpa. Shown results are in units
of N/mm2 (MPa).
You can
double-click the plot in the Simulation study tree if it does not
appear.
- Right-click Stress1 (-von Mises-) and select Show as 3D plot.
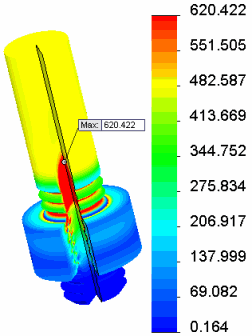
The analysis is displayed on the 3D model that results
from
revolving the 2D section through 330°. To change the revolve angle, right-click the plot
in the Simulation Study tree, and click Edit
Definition. In the Stress Plot
PropertyManager, select Advanced Options and
change the angle.
The result indicates plastic deformation on the model. Among the contacting threads, the first engaged thread shows a high stress value. The values are lower for the subsequent threads.
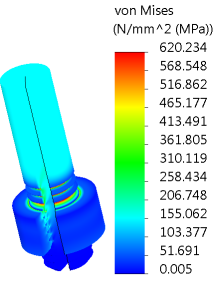
- In the Simulation study tree, right-click Force -1 and click Edit Definition.
- Change the force to 1000 lbf and click
 .
.
- Right-click Stress1 (-von Mises-) and clear Show as 3D plot.
-
Click Run
(Simulation
CommandManager).
The 2D analysis indicates that the model does not yield to
stress when you apply one third of the force. The von Mises stress plot on the 3D model is
shown.
Congratulations! You have completed this tutorial.