You control the look of the plot fringes and the plotting of the model
boundaries through the Settings
PropertyManager.
-
In the Simulation study tree, right-click the Bottom von Mises plot icon and select Settings
 .
.
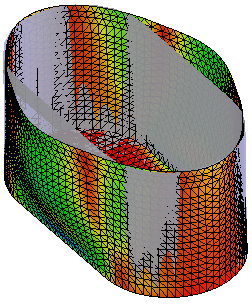
- In the PropertyManager, under Fringe Options, select Point, Line, Discrete, and Continuous (default).
-
Under Boundary Options,
select None, Model (default), and Mesh.
Again, notice how the display of the model boundary changes as
you change your selection.
- Under Deformed Plot Options, do the following:
- Select Superimpose model on the deformed shape.
-
From the menu, select Translucent (Single color).
-
Drag the slider to the left (low transparency) to
superimpose the undeformed model on the deformed shape.
 |
| Low
transparency |
-
Click OK.
Congratulations! You have completed this lesson.