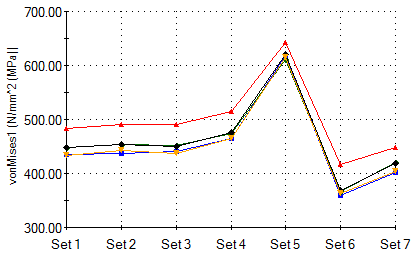
You graph the variation of the maximum von Mises stress in the model with the scenario number.
-
In the left frame of the hanger study tab, right-click the Results and Graphs
 folder and select Define Design History Graph.
You cannot plot a local trend graph for an Evaluation Design Study with High quality (slower) setting for the study quality. For more information about graphs available for different settings in a Design Study, see SOLIDWORKS Simulation Help: Design Study Outcomes.
-
In the PropertyManager, under Y-Axis, select Constraint.
- Select vonMises for Constraint.
- Under Extra Location, select <Ready> - Design Scenario and select the four vertices from the selection box.
- Click
 .
.The graph shows the variations of the vonMises stress for all scenarios. The maximum values are in red. The other plots correspond to the four vertices referenced by the workflow sensitive sensor.
- Close the graph window.