Design history graphs plot the variation of variables or a constraint
or a design variable with respect to the scenario number.
-
In the left frame of the Design
Study tab, right-click the Results and
Graphs
 folder and select Define Design History Graph.
-
In the PropertyManager, under Y-Axis, select Design
Variable and click
 .
.
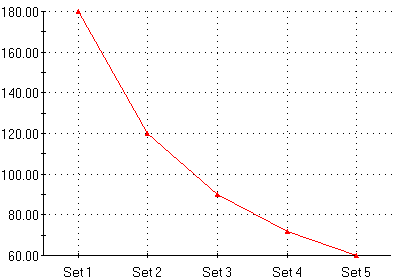
The following graph shows how the angle between the
spokes (in degrees) with respect to the scenario numbers.

-
Close the graph.
-
Graph the variation of the values of a sensor defined as a
constraint with respect to the scenario number.
-
In the left frame of the Design Study tab, right-click the Results and Graphs
 folder and
select Define Design History
Graph.
-
In the PropertyManager, select Constraint.
-
From the list, select the Frequency 1, Frequency
2, Frequency 3,
Frequency 4, and Frequency 5 sensors.
-
Click
 .
.
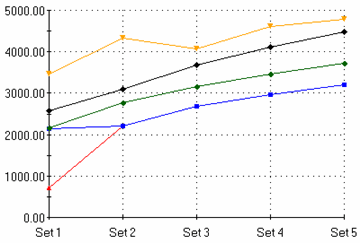
The following graph appears. The graph shows how the five resonant
frequencies (in rad/s) change with respect to the scenario number.

-
Close the graph.