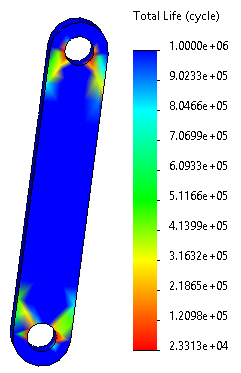
Running Fatigue Analysis and Viewing Results Right-click Fatigue 1 in the Simulation study tree and click Run. Notice that the program creates a Results folder where fatigue result plots are created. Right-click the Results folder and click Define Fatigue Plot . In the PropertyManager: Under Plot Type, select Life. Click . The Total Life plot is displayed. The life plot shows that failure due to fatigue is likely to occur at the two holes after approximately 23,313 cycles. Parent topicFatigue Analysis of a Link Part Previous topic Viewing the SN Curve assigned to the Material Next topic Viewing Damage and Factor of Safety Plots