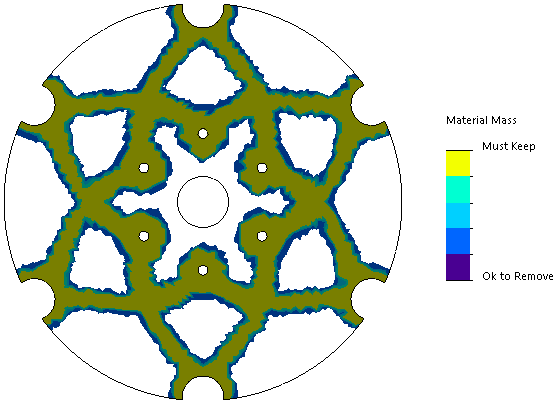
When the optimization analysis completes, the Material Mass plot shows
the elements that must remain in the optimized geometry and those that you can
remove.
-
From the Heads-up View toolbar, set View
Orientation to Top. Hide all applied
fixtures, loads, and manufacturing controls from the graphics area.
-
In the Optimization study
tree, under Results

 , right-click Material Mass 1(-Material Mass), and click
Edit Definition.
, right-click Material Mass 1(-Material Mass), and click
Edit Definition.
In the PropertyManager, under
Display, the default position of the Material Mass isovalue
slider ensures that the required elements remain intact after
optimization.
Optimization results in a Material
Mass plot are mesh-sensitive. You can refine the mesh to optimize the
geometry, obtain a smoother mesh, and improve the
granularity.
-
Click Calculate Smoothed Mesh
 .
.
The software creates a smoother geometry from the active Material
Mass plot. It removes or modifies elements that created jagged edges and sharp
angles.
-
Under Advanced Mesh Smoothing
Options, move the Number of
Cycles slider to Smooth.
Moving the slider to Smooth,
applies higher number of mesh smoothing cycles.
-
Select Specify color for Smoothed Mesh. From the list,
select Single color.
-
Click Choose Color for Smoothed
Mesh
 . From the Color menu, select orange
  .
.
-
Switch back to the Material Mass plot view. In the PropertyManager, click
Show Material Mass plot
 .
.
-
Click
 .
.
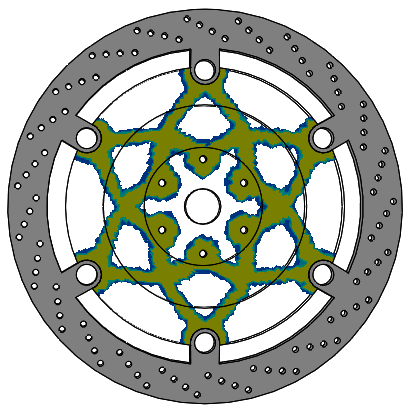
You can also view the optimization results in the context of the
assembly. Switch to the
Model tab.
- From the View menu,
click
 .
.
- In the Simulation Display
PropertyManager, under Selected Result,
select Material Mass 1 plot.
- Click .
The image shows the default Material Mass plot superimposed on the tutorial
assembly.
View Orientation set to
Top.