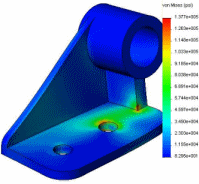
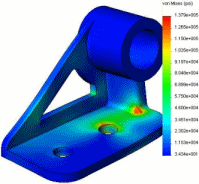
The gallery includes images of the displacement and stress plots of the baseline and subsequent iterations
-
Right-click the Trend Tracker
 folder and select View Gallery.
- Scroll through the images of the gallery.
The last two images with the von Mises stress are shown in the figure as an example.


- Close the Windows Photo Viewer.