After running the specific scenarios of your design, you are ready to view the results. The program automatically switches to the Results View tab to display the results.
For more information about viewing the results of design studies, see SOLIDWORKS Simulation Help: Design Studies.
-
On the Results View tab, observe the results for Scenario 1.
The angle between the spokes and the first five frequencies are listed below in the table.
| |
Scenario 1 |
|---|
| Angle |
180 deg
|
| Frequency 1
|
715.43 rad/s |
| Frequency 2 |
2150.14 rad/s |
| Frequency 3 |
2160.94 rad/s |
| Frequency 4 |
2576.42 rad/s |
| Frequency 5 |
3467.31 rad/s |
The results are the same as for the initial frequency study.
-
On the Results View tab, observe the results for Scenario 5.
| |
Scenario 5 |
|---|
| Angle |
60 deg
|
| Frequency 1
|
3210.68 rad/s |
| Frequency 2 |
3211.37 rad/s |
| Frequency 3 |
3716.57 rad/s |
| Frequency 4 |
4471.02 rad/s |
| Frequency 5 |
4789.75 rad/s |
- Select the column named Scenario 5.
The program updates the model in the graphics window.
- On the left frame of the Pulley_Designs tab, under Results and Graphs
 , select Frequency 3
  .
.
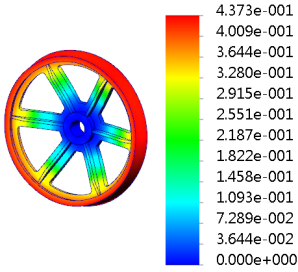
The program plots the mode shape amplitudes (AMPRES) for the third
frequency. To control the plot results in a Design Study, click Simulation,
Options, Default Options, Frequency/Buckling Study Results.
-
Similarly, view the results for other frequencies and
scenarios.