You plot the stress time history at the location of the workflow sensitive sensor.
-
In the Simulation study tree, right-click Results
 and select Define Time History Plot.
The Node number of the predefined sensor location is highlighted
under Response.
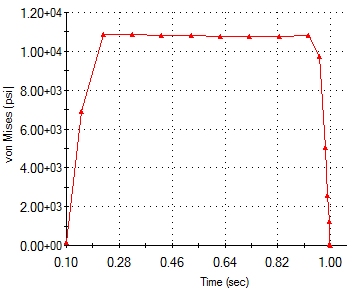
- In the Y axis box, set Stress, VON: von Mises Stress for Component
 .
.
-
In Units
 ,
select psi.
,
select psi.
-
Click
 .
.
A time history graph for the von Mises stress at the
selected node appears.
Congratulations! You have completed this lesson.