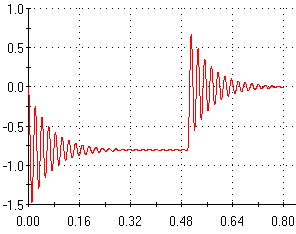
When the analysis completes, you can plot results for the model at any solution time step, or you can plot response time history graphs for Point 1.
- In the Simulation study tree, right-click the Results
 folder and select Define Response Graph.
Point 1 is highlighted in the Predefined locations box.
-
In the PropertyManager, under Y axis do the following:
- Select Displacement.
- Set Component
 to UY: Y Displacement.
-
Set Units
 to in.
-
Click
 .
.
The time history graph of the UY-displacement component
appears in the graphics area.
X-axis is sec and Y-axis is in.

The response graph clearly depicts oscillations of the
basketball rim occurring during the slam dunk. The maximum UY displacement
is approximately 1.35 in. This value is greater than 0.78 in which is the
maximum static UY displacement of the rim (see the UY displacement plot of
Static study). The hoop comes to rest at the end at about 0.32 sec. After
releasing the load, the rim undergoes free vibrations until it recovers its
initial position at about 0.8 sec.
To test the accuracy of the results, run a second dynamic
study using 10 modes. The results show minor changes in the response
indicating that using 5 modes gives accurate results in this case. In many
cases, a larger number of modes may be required.
Congratulations! You have completed this lesson.