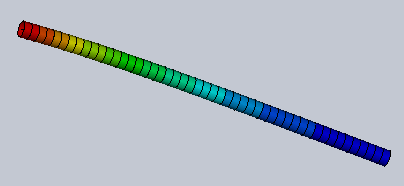
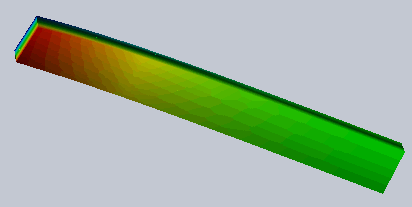
In stress plots, nodal as well as element results are available for beams. As before, element plots display on cylindrical cross sections.
If the Render beam profile option is cleared in the Stress Plot PropertyManager, the software assigns the highest stress value for the element and axial components. For example, you can select from Highest axial and bending, Highest Bending in local direction 1, or Highest Bending in local direction 2.

If the Render beam profile option is selected in the Stress Plot PropertyManager, bending stresses vary across the cross-section, as well as along the axis of the beam. For example, you can select from Axial and bending, Bending in local direction 1, or Bending in local direction 2, which indicates that the values vary throughout the cross-section.

This option can be slow in studies with many beam elements. To improve performance in these instances, limit the rendering of the beam to the final results.