You can predict the damage and remaining life of a part that is exposed to repeated cyclic loading at a given operating frequency or to a random vibration environment.
Available for SOLIDWORKS Simulation Premium.
You can perform fatigue analysis based on frequency domain events that use the results from linear dynamic harmonic and linear dynamic random vibration studies.
The output of fatigue studies based on frequency domain events include remaining life and damage plots. For random vibration-based fatigue studies, a Time to Failure plot is included as well.
Fatigue based on Harmonic Results
A fatigue study that is based on stress results as a function of frequency from a linear dynamic harmonic study, predicts the remaining life and damage of a part under periodic (or sinusoidal) vibration of a given number of cycles at a certain operating frequency.
The calculation of the cumulative damage ratio is based on the Linear Damage rule or Miner's rule:
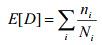
where E [D] is the expected damage ratio, nI is the number of cycles the part is subjected at a certain operating frequency and alternating stress SI and NI is the number of cycles required to cause failure at stress level SI given by the material's S-N curve.
Fatigue based on Random Vibration Results
To estimate the fatigue life when the stress or strain histories obtained
from the structure or component are random in nature (and therefore best described using statistical parameters like probability density functions, upward zero crossings, and number of peaks per second), these frequency domain computational methods are available:
- Narrow Band
- Steinberg
- Wirsching
The assumption of a frequency-based fatigue life prediction is that the response parameters (stress and strain) of the model being analyzed are random, stationary, and Gaussian in nature.
Unlike other fatigue studies, the material S-N curve is defined using Basquin’s equation:
N = B / (Se )m
where N = allowable number of cycles to failure; B = curve-specific constant (the intercept of the S axis); Se = stress range of cyclic load; m = slope of the linear S-N curve.
This equation shows that under constant
amplitude cyclic loading a linear relationship exists
between cycles to failure N and applied stress range Se
when plotted on a log-log scale.