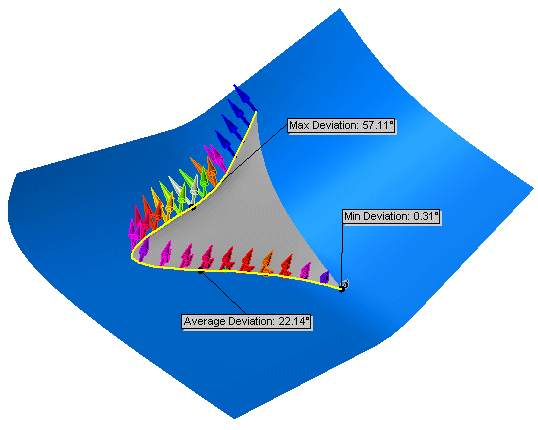
The Deviation Analysis tool is a diagnostic tool that calculates the angle between faces.
To apply a deviation analysis:
-
Open the model with the edges you want to examine.
 |
| Sample model using a surface fill |
- Click Deviation Analysis
 on the Tools toolbar, or .
The Deviation Analysis PropertyManager appears.
- Under Analysis Parameters
 , select the edges in the graphics area that you want to examine.
- Use the slider to select the Number of Sample Points
 to include in the analysis.
 The number of points is based on the size of the window client area. If you select more than one edge, the sample points are distributed across the selected edges, proportional to the edge length.
- Click Calculate.
The colored arrows display the amount of deviation. The results appear for the following criteria between the adjacent faces:
| Maximum Deviation |
The maximum deviation error along the selected edge. |
| Minimum Deviation |
The minimum deviation error along the selected edge. |
| Average Deviation |
The average between the maximum and the minimum values along the selected edge. |
You can change the display colors for Maximum Deviation and for Minimum Deviation. To change the colors, click Edit Color to display the Color palettes, select a color for each deviation type, and click Calculate to apply the new colors.
