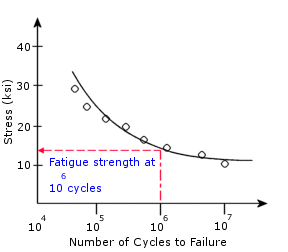
Fatigue strength is determined by applying different levels of cyclic stress to individual test specimens and measuring the number of cycles to failure. The graphical representation of fatigue data points is the cyclic stress amplitude or alternating stress (S - vertical axis) versus the number of cycles to failure (N - horizontal axis). Fatigue strength is defined as the stress at which fatigue failure occurs at a given number of cycles. A typical S-N curve is shown below.

Usually the base 10 logarithm of number of cycles N is used instead of N due to the typical large range of N values. In SOLIDWORKS Simulation, you can choose from three interpolation schemes to locate intermediate data points on an S-N curve: Log-Log, Semi-Log, and Linear. For examples of SN Interpolation schemes, see SOLIDWORKS Simulation Help: Example of SN Interpolation Schemes.
Specimens are tested in a series of decreasing stress levels until no failure occurs within a selected maximum number of cycles (usually 10 million cycles). The nearly horizontal portion of the curve defines the fatigue or endurance limit for the test material. If the applied stress amplitude is below the endurance limit of the material, the specimen is said to have an infinite life. For many non-ferrous metals and alloys such as aluminum, magnesium, and copper alloys, however, there will not be a definite endurance limit and the low stress portion of the curve will not converge to a horizontal line. These materials instead display a continuously decreasing S-N curve.
An S-N curve for a material defines cyclic stress amplitudes (or alternating stress) versus the number of cycles required to cause failure at a given stress ratio R. Stress ratio R is defined as the ratio of the minimum cyclic stress over the maximum cyclic stress. For a fully reversed loading, R = -1. When the loading is applied and removed (not reversed), R=0.
Experimental results have shown that the mean stress has a significant impact on the fatigue resistance of a specimen. For any material, you can define multiple S-N curves (up to ten) where each S-N curve corresponds to a different stress ratio R. The software then uses linear interpolation between the S-N curves to extract data for a given stress ratio.
When one S-N curve with stress ratio R = -1 (fully-reversible or zero-mean stress) is used to define the fatigue properties of a material, you can select a correction method (Goodman, Gerber, or Soderberg) to account for the effects of non-zero mean stresses.
S-N curves are based on mean fatigue life or a given probability of failure. Generating an S-N curve for a material requires many tests to statistically vary the alternating stress, mean stress (or stress ratio), and count the number of cycles to failure.
Tests to generate S-N curves are performed under a controlled loading environment. In most cases, the S-N curves are obtained from uniaxial loading on fully-reversed stress cycles. Since the actual loading environment is generally multi-axial, you may need to reduce the fatigue strength. The software provides the Fatigue strength reduction factor in the Fatigue dialog box to account for this discrepancy.