Use a random vibration study to calculate the response due to non-deterministic loads. Examples of non-deterministic loads include:
- Loads generated on a wheel of a car traveling on a rough road
- base accelerations generated by earthquakes
- pressure generated by air turbulence
- Pressure from sea waves or strong wind
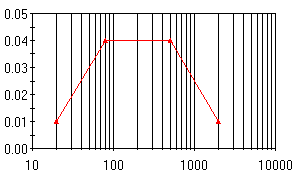
In a random vibration study, loads are described statistically by power spectral density (psd) functions. The units of psd are the units of the load squared over frequency as a function of frequency. For example, the units of a psd curve for pressure are (psi)2 / Hz over Hz.
A sample psd curve is shown below. The X axis (frequency Hz) is plotted on a logarithmic scale for a clear illustration of the wide frequency range. The unit for Y-axis is amplitude
2/ frequency.

The solution of random vibration problems is formulated in the frequency domain (see Simulation help: Analysis Procedure - Random Vibration).
After running the study, you can plot root-mean-square (RMS) values, or psd results of stresses, displacements, velocities, etc. at a specific frequency or graph results at specific locations versus frequency values.
Modal, Rayleigh, and Composite modal damping options are available for this type of analysis. See Damping Effects.