Description
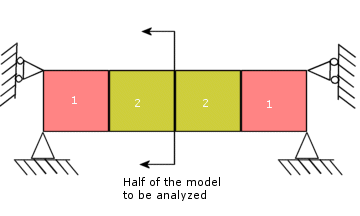
A plate is made of two different materials as shown in the figure. The plate thickness is 0.1". Determine the thermal stresses due to temperature changes of 100 ºF and 200 ºF. The full model is shown below:

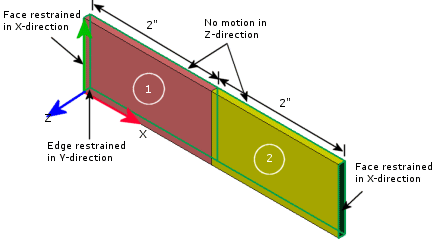
The following figure depicts the loads and restraints applied to the half model.

File Name
Browse to drive
letter:\Users\Public\Public Documents\SOLIDWORKS\SOLIDWORKS
version\samples\Simulation
Examples\Verification\Nonlinear_Static_4.SLDASM and open the
file.
Meshing Parameters
Use a Global Size of 0.5".
Material Model
Linear elastic isotropic material with temperature dependency.
Material Properties
Poisson's ratio = 0, Coefficient of thermal expansion = 1 X 10
-5 /ºF. Modulus of elasticity for part 1 of the plate is = 3 X 10
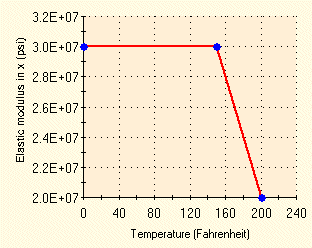
7 psi. The modulus of elasticity of part 2 is temperature-dependent as follows:

Restraints and Loads
Due to symmetry, only one half of the plate is modeled. The right face of the plate is simply supported and the back faces are restrained in the Z-direction. The lower right edge is restrained in the Y-direction.
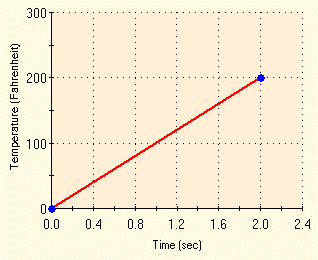
Two uniform changes in temperature (ΔT1 = 100 ºF and ΔT2 = 200 ºF) have been applied, one at a time, to both parts of the model. Each temperature rise followed the time curve shown below:

Results
| Maximum compressive SX:Normal
Stress
(psi) |
ΔT1
= 100 ºF |
ΔT2
= 200 ºF |
| Theory |
-30,000 |
-48,000 |
| SOLIDWORKS Simulation |
-30,000 |
-48,006 |
The results from the above curve are in agreement with analytical results.