- Mesh the model with the default element size and tolerance. Select
Automatic Transition under Mesh Parameters.
- Run the study with the shell mesh.
- Right-click the stress plot and select Edit Definition.
- In the PropertyManager, for Shell
face
 , view the equivalent stresses on
the Top and Bottom shell faces.
, view the equivalent stresses on
the Top and Bottom shell faces.
| Von mises stress plot for the top shell
face |
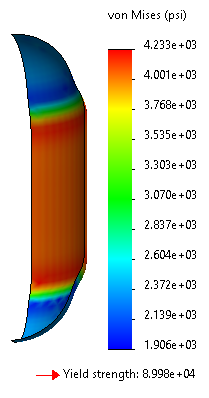
Von mises stress plot for the bottom shell
face |
 |
 |
When viewing results of shell models, it is important to
view results on top and bottom faces. The default color for shell bottom faces is
orange. View the mesh to identify the top and bottom shell faces of your model.
| |
Maximum von Mises stress (psi) |
| Study with Solids |
4.303e+03 |
| Study with Shells |
4.141e+03 (top shell faces) 4.233e+03
(bottom shell faces) |
Congratulations! You have completed this lesson.