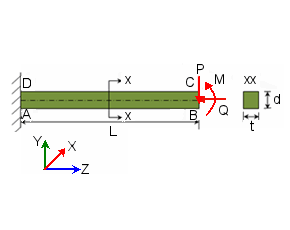
Determine the nonlinear response at the tip of a straight cantilever
beam subjected to different end load conditions.
Dimensions are in m.

L = 3.2 m, d = 0.1 m, t = 0.1 m.
For Study A, P = 0, Q = 0, M = 3.4361 x
106 Nm.
For Study B, P = 1.709 x 10⁶ N, Q = 0, M =
0.
For Study C, P = 3.844 x 10⁶ Nm, Q = 3.844
x 103 Nm, M = 0.
|
File Name
|
Open drive
letter:\Users\Public\Public Documents\SOLIDWORKS\SOLIDWORKS
version\samples\Simulation
Examples\Verification\NAFEMS_GNL5.SLDPRT.
|
|
Material Properties
|
- Elasticity modulus (E) = 2.1 x 10¹¹
N/m2
- Poisson's ratio (ν) = 0
|
Results
Define Workflow Sensitive sensors at the target
location, and use the Probe tool to plot the graphs. Process the
results using graphing software to generate the graphs. Click on the links at the bottom
of the page to see the results for each study.
The response curves for all studies agree with the finite element solution
provided in the reference.
Reference
NAFEMS Publication R0065, The International Association for the Engineering
Analysis Community, “Background to Finite Element Analysis of Geometric
Non-linearity Benchmarks, 1999”.