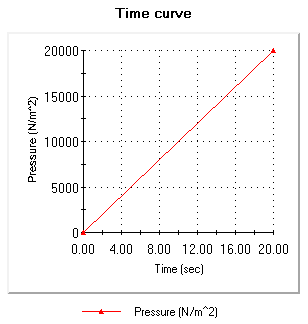
In nonlinear analysis using force control, loads are applied in incremental steps through the use of time curves. A time curve prescribes how a load or restraint changes during solution steps. The X-axis of a time curve represents the time and the Y-axis represents the intensity of the applied loads at a certain solution step. Time in this problem is a pseudo variable that is used to increment the loads.
In this step, you define a pressure load and associate it with a time curve.
To apply the pressure:
-
In the Study 1 study tree, right-click the External Loads
 icon and select Pressure.
-
In the PropertyManager:
- Make sure that Type is set to Normal to selected face.
- In the graphics area, click the front face of the plate as shown in the figure.
Selected face appears in the
Faces for Pressure box

.
- Under Pressure Value, set Unit
 to N/m^2 then type 20000 in the Pressure Value box
  .
.
- Under Variation with Time, click Curve then click Edit.
-
In the Time curve dialog box:
- In the curve data table, make sure that zeros appear in the X and Y columns of the first row.
- In the second row, type 20 and 1 in the X and Y columns respectively and click OK.
-
In the Pressure PropertyManager:
- Click View to graph the time curve.
The following
Time curve window opens.

Notice that the Y axis represents the actual value of the applied pressure during each solution step.
- Click
 .
.