You run the analysis and view the von Mises stress plot at the last solution step.
To plot von Mises stress at the last solution step:
-
In the Simulation study tree, double-click the Stress1 icon in the Result folder.
The default von Mises stress is displayed.
-
In the Stress plot
PropertyManager, in the Display box, set
Units
 to psi.
-
Click
 .
.
The following plot is displayed.
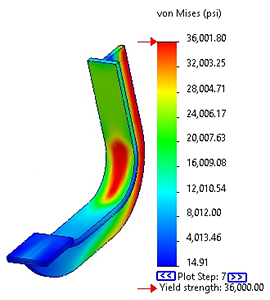
The plot shows that the part has just started to yield.