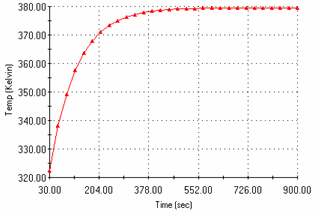
You use the Probe tool to plot the temperature-time curve (also called the response graph) of desired locations of the model as follows:
-
In the Simulation study tree, activate Thermal1 (-Temperature-) by double-clicking its icon.
-
Click Plot Tools
 (Simulation CommandManager) and select Probe
  .
.
-
Select the vertex shown.
-
In the PropertyManager under Report
Options, click Response
 .
.
The graph shows the temperature (y-axis) of the selected
vertex versus time step number (x-axis).

This graph shows that the steady state condition is reached
approximately in 600 seconds (corresponds to the 20th time step).
-
Close the graph window by clicking .
-
Click
 .
.
-
Save the analysis results and close the assembly document. You will use this document in the next tutorial.
Congratulations! You have completed this lesson.