Temperature profile at 900 seconds (the last time step)
is displayed.
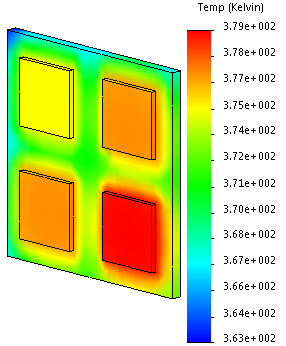
The
temperature profile at 900 seconds is almost identical (0.4% off) to the
steady state solution obtained in the first part of this tutorial. To reach
higher levels of accuracy, increase the mesh density to the default mesh
size. A coarse mesh is intentionally used in this example to reduce the
analysis time.