Transient analysis provides temperature profiles at the requested solution times.
To view temperatures at 30 seconds:
-
In the Simulation study tree, open the Results
 folder.
-
Double-click Thermal (-Temperature-) to display the plot.
If the plot does not exist, create this plot.
-
Right-click Thermal (-Temperature-) and select Edit Definition.
-
In the PropertyManager under Display, select Kelvin in Units
 .
.
-
Under Plot Step, set
 to 1.
to 1.
-
Click
 .
.
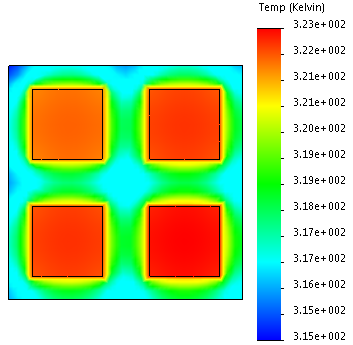
Temperature profile in Kelvin (K) at 30 seconds (the
first time step) is displayed.