Result plots are defined by default at the last solution step. You can define result plots at any other solution step. You can also define envelope plots across all solution steps. Since we have requested the storing of results at the first 100 steps all the steps need for convergence by autostepping will be available.
To plot resultant displacements:
-
In the Simulation study tree, right-click the Results
 folder and select Define Displacement Plot.
-
In the PropertyManager, under Display:
-
Make sure URES: Resultant
Displacement is selected in Component
 .
.
- Select in for Units
 .
.
-
Under Deformed shape, make sure True scale is selected.
-
Click
 .
.
The following plot is displayed. This is the resultant
displacement plot for the last solution step.
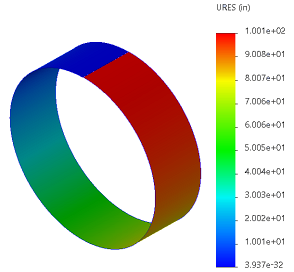
The magnitude of the maximum resultant
displacement for the last solution step is 100 inches (the length of the
sheet).