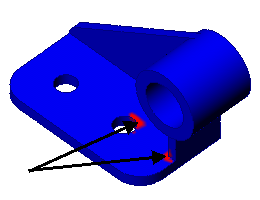
Regions with a factor of safety less than 1 (unsafe regions) are shown in red. Regions with higher factor of safety (safe regions) are shown in blue.

For a better view of critical regions of the model, you may need to hide the restraints and pressure symbols. Right-click the Fixtures and External Loads folders and select Hide All. Double-click the Factor of Safety icon under Results to display the factor of safety plot again.