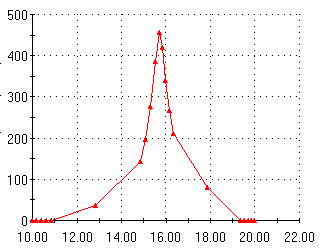
The unit for X-axis is Frequency (Hz), and for Y-axis is AY amplitude (in/sec2). The peak acceleration occurs at frequency 15.69 Hz (second natural frequency). The graph depicts the peak positive acceleration at the mid-span for the range of operating frequencies. In reality, both beams undergo negative and positive accelerations due to the applied harmonic load.