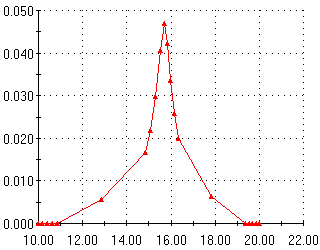
When the analysis completes, you can plot results for the assembly at any frequency step, or you can plot response graphs for Point 1 for the whole frequency range. Next, plot peak vertical displacements at mid-span.
- In the Harmonic study tree, right-click the Results
 folder and select Define Response Graph.
Point 1 is highlighted in the Predefined locations box.
-
In the PropertyManager, under Y axis do the following:
- Select Displacement.
- Set Component
 to UY: Y Displacement.
- Set Units
 to in.
- Click
 .
.The time history graph of the UY-displacement component appears in the graphics area.
X-axis is sec and Y-axis is in.

The horizontal axis is Frequency (Hz), and the vertical axis is UY (in). The peak deformation occurs at frequency 15.69 Hz which is equal to the second natural frequency. The graph depicts the peak positive deflection at the mid-span for the range of operating frequencies. In reality, the beams vibrate between negative and positive displacements.