You can create contour plots from data imported from an external file.
Available for linear static, nonlinear static, frequency, thermal, buckling, linear dynamic,
nonlinear dynamic, drop test, and 2D Simplification studies.
- After generating the mesh, right-click the top study icon of a study tree,
and click Plot Imported Results.
Plot Options
For accurate mapping of results
data, the current mesh of the active study and the mesh from which the imported results
are derived must be identical. The imported data are mapped per node or element number.
Gray regions in contour plots represent node or elements without mapped values.
|
Frequency, Thermal, Buckling, Linear and
Nonlinear Dynamic, Drop test studies and 2D Simplification
studies.
|
Browse for Input File
|
Select the input file with the
result data. Supported input data formats are comma-separated
(*csv) or text (*.txt)
files. Data are stored in two columns. First column lists the nodes
or element numbers. Second column lists the plot numerical values
(per node or element). You can use a single
space, a tab space, or a comma as a delimiter. Use the letter
"e" for the power of 10 multiplier. Do not use a comma to
represent the thousand separators. Sample input file formats are
shown below.
|
| |
Legend title text
|
Type the plot legend name of the
external data. You can include the units of the data in the
title. |
| |
Node Values/Element Values
|
Select either node values or
elements values to map the respective external data. For accurate data mapping, the current mesh of
the study and the mesh from which the imported results are
derived must be identical.
|
 |
 |
 |
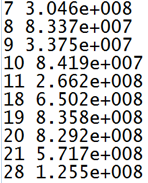
| Sample txt input file with single space as
delimiter. |
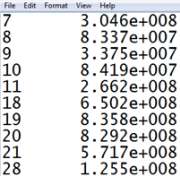
Sample txt input file with single tab as
delimiter. |
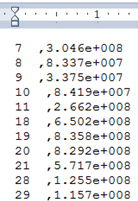
Sample CSV file with comma as delimiter. |